It’s a new year (Happy New Year!) and for me that means researching what is going to take shape for the real estate market in the year ahead. I really enjoy the process of researching, accumulating data and then interpreting the data to come up with my own conclusion/ market predictions of what is going to happen.
The real estate market is actually… in a very good spot right now. It’s healthy, despite the many reports stating differing opinions.
There is lots of inventory and by that, I mean lots of properties listed “For Sale” but not too, too many. Just the right amount. It’s kind of like Goldilocks and the Three Bears…. don’t worry, ill stop there, hopefully you get my analogy.
In previous years we seen very little inventory (January – May, 2017) which resulted in an extreme escalation in the median and average sales prices, where as back in December 2008 thru February 2009, we seen way too much inventory which resulted in a sharp decrease in the median and average price.
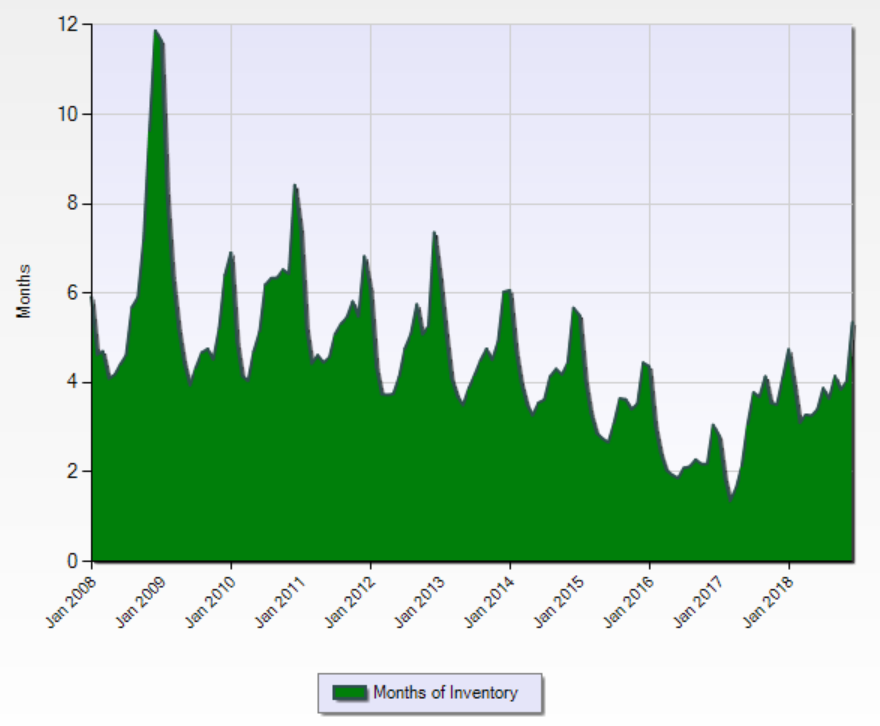
[Figure-1] – Months of Inventory dating back 10 years. Includes Residential sales only for the following areas, Dufferin, Durham, Halton, Hamilton, Niagara, Peel, Simcoe County, Toronto, Waterloo and York. Data taken from Matrix MLS System (Approx. 600,000 listings)
The chart above (Figure-1) shows the Months of Inventory dating back to 2008. It is derived from approximately 600,000 listings throughout the GTA. If you know me, you know that I love this statistic because it can quickly tell us what type of real estate market we are currently experiencing. It can be used to effectively segment the real estate market and determine what kind of market a specific type of property is experiencing, because different types of properties in different locations can have different market conditions. Example; a bungalow in north Barrie, that is 1,800 sqft can have a dramatically different market condition than a two-story home with 2,200 sqft in south east Barrie.
Currently we have 5 months of inventory (December 2018) and from my perspective that would be considered an equal, balanced real estate market for the Greater Toronto Area (areas included in this stat shown above.) The 10-year median and average months of inventory is, 4 months of inventory, which is also in my opinion, considered an equal balanced real estate market.
If you are wondering what the heck is Months of Inventory and what does it mean, basically this statistic looks at the number of properties that are currently listed for sale (Active Listings), and then it takes into account the average number of sales the market has experienced in the past number of months (Average Rate of Sales), from there, it takes both of those figures and computes if we were to continue to sell properties at the same average rate, how many months would it take to sell all of the current active properties listed for sale. This figure is the current months of inventory. A number such as 0.5 or even 3, would tell us we have very little inventory (Sellers Market), where as a number like 6 or 10 or even higher would tell us we have a lot of inventory (Buyers Market).
Ok, we have established that we have normal, healthy, balanced levels of inventory, but what about prices?
The next thing that I looked at was the median sales price, I was looking for trends that date back to the past 10 years.
(You will always see me use the MEDIAN rather than the average where possible. I find this to be more accurate. For those that don’t know or maybe just need a refresher, the median is the middle, in that if you put a series of numbers in order from smallest to largest, the median would be the number in the middle. I find the average can often be skewed if you have a really big sale of say $20 Million or even a smaller sale of $1, either number can dramatically throw off the average).
As you will see from the following chart (Figure-2), we had steady consistent growth of the median sales price from 2008 up until the beginning of 2016, at which point we started to see a sharp increase in prices.
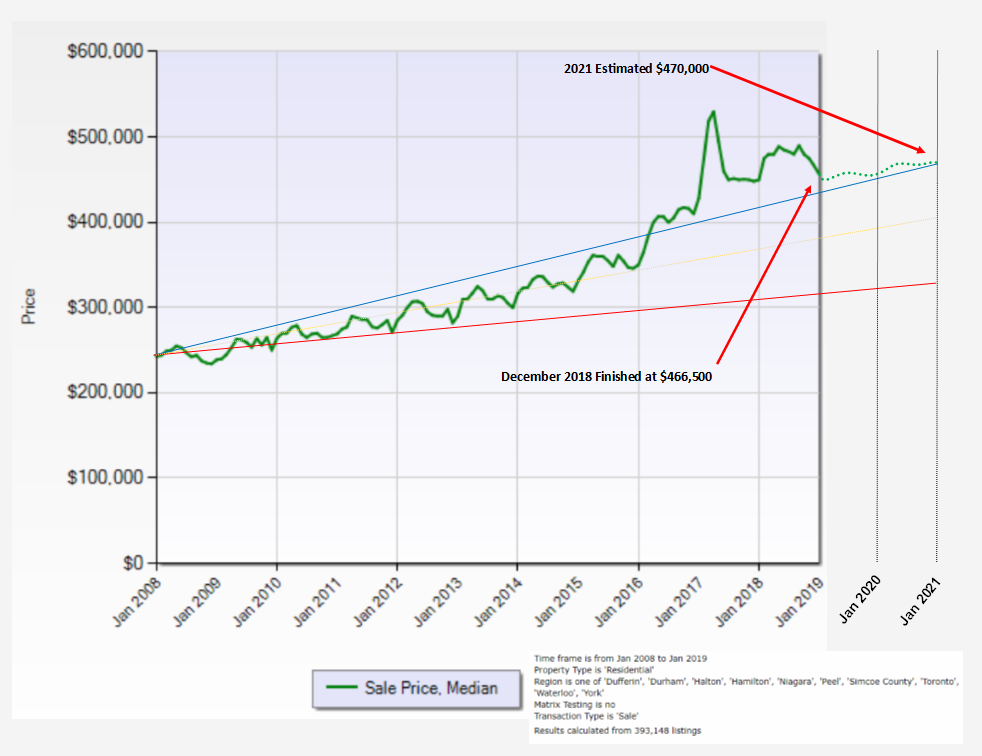
What you are seeing above; the wavy green line represents the median sales price from January 2008 to December 2018. The straight blue line is a line that I drew on the chart that mirrors the top of the market. I continued the line to forecast where the market should be at if it was on the same trend line in 2021.
Based off this chart, as it relates to the blue trend line, the current real estate market is overvalued.
The green dotted line, that extends from January 2019 to January 2021 is my own prediction of where we will see the market go.
I predict that we will see very modest growth in the median sales price for the next two years.
The next thing that I wanted to investigate was the relationship and trend between the average rental rate, household income and the average sales price. It took some time, but I assembled and collected data from stats Canada, Canadian Mortgage and Housing Corporation (CMHC) as well as my local real estate board and when I was done, I had information dating back to the 1970’s, except for the average rental rates (which I am still hoping to compile).
I then converted the data into year over year percentage increase/decreases which enabled me to tie all the data together and make it measurable. The result…. a very, very telling chart…. See the results below:
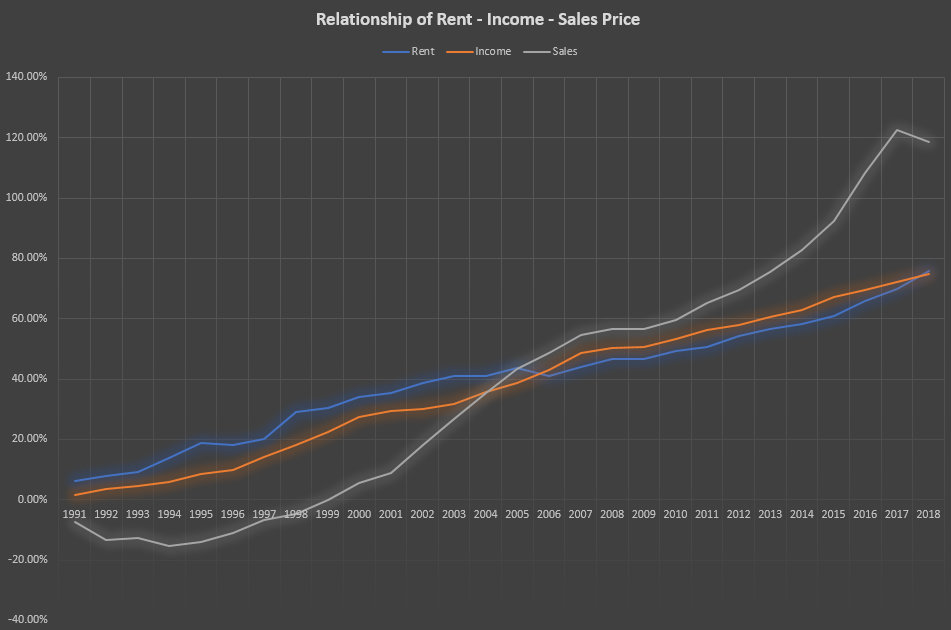
Isn’t it amazing to see how close the relationship is regarding the growth of the average rent and the household income per capita?
And then we have the average sales price. It’s like the goofy step child (no offence haha). As you can see the average sales price is all over the place. The start of this chart is 1990 which if you have read a previous report of mine (Real Estate Market Outlook 2017), you might remember that the average sales price in Ontario has only decreased a total of 7 years, dating back to 1960, (if you didn’t read that report, reach out and I can send to you) and of those 7 years where we experienced a decrease in the average sales price, five of them happened to be in the 1990’s. For this reason, I really want to take this chart back to 1970 and when I get the rest of the average rental rates, I will do just that.
Even though, in my opinion, there is more work to be done on this chart, the current chart (Figure-3) tells us all we need to know.
Once I had assembled all the data and generated the chart you see above (Figure-3), I was blown away!
Look at how inflated the average sales price is, when compared with both the rental rates and the annual income.
If you were not convinced from Figure-2 that the real estate market is set to slow down, Figure-3 should cement that notion.
It’s already been stated earlier, but I will state it again, it is my educated opinion that for 2019, we will be lucky to experience any increase in the average or median sales price. We will most likely see a few peaks and upward trends followed by a few valley’s and downward trends. At the end of the year we will be lucky to have increased by even a percent or two, and it’s entirely possible that we may experience a decrease in the average/median sales price.
This does not mean you should hold off on selling or buying or even investing in real estate.
As I started this, whatever you would call it (report, blog, essay) I stated that the current real estate market is healthy, and it really is.
If you are Selling, you can sell…. If you are buying, it’s a great time to buy as there is many properties to choose from and in most cases you can negotiate. That is a balanced, equal market.


