Housing market update for the first quarter of 2023 for, Barrie, Simcoe County & the greater Toronto area (GTA).
The main theme of this update is riding on a rollercoaster, because as you’re going to see, we’ve got lots of going up and we’ve got lots of going down. I am going to bring them all together and give you perspective of where things are at and where they may be headed.

Here are some of the things we are going to talk about:
- Home sales down
- Inventory down
- Prices down
- GDP down
- Mortgage rates up
- Cost of living up
- Population up
View all the corresponding graphs and charts.
Home Sales –
The first quarter of 2023 home sales across the Greater Toronto area are considerably down. This compared to years prior, we are considerably below average. This is across the GTA including Barrie and Simcoe County.
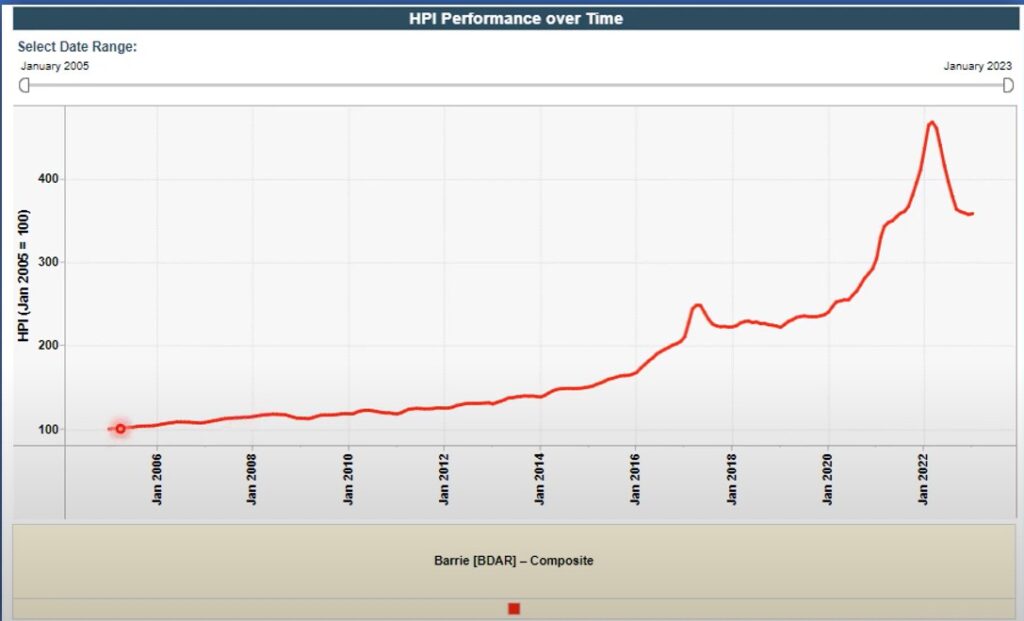
Home Prices –
When looking at the home price index (HPI) which tracks sales prices overtime, as of late we can see a steady decline of prices with peak prices coming back in February 2022. As of January 2022 to January 2023, the HPI shows nearly an 18% decline in prices for Barrie, Ontario.
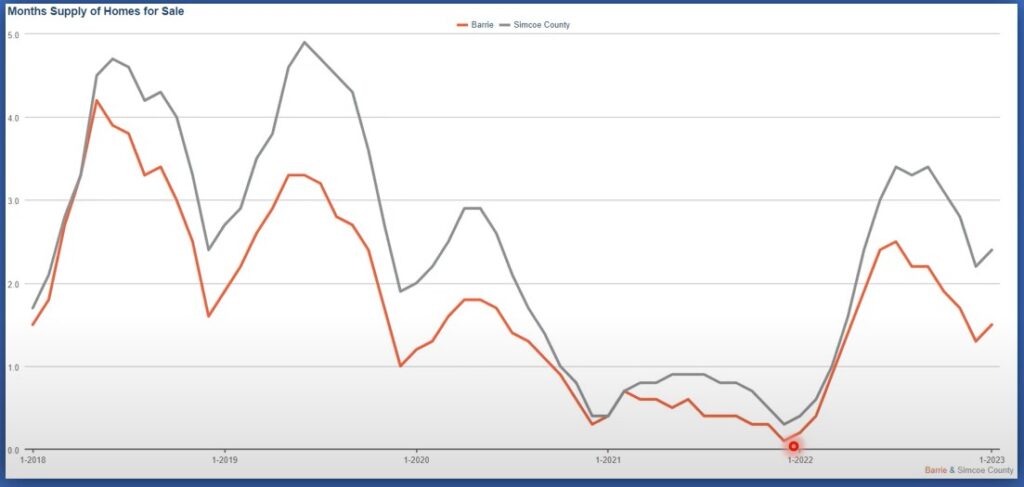
Inventory Levels –
One of the contributing factors as to why we have not seen house prices drop even more then they have already is due to current inventory levels. Inventory levels continue to be down as you can see.
For some perspective, back in the summer of 2021, I had recorded months of inventory in Barrie to be around 3 days! What 3 days means is if there was no more active listings to come onto the market, but the market continued to sell houses/ units based on the current average unit sales within a month, then it would have taken only 3 days to sell all of the active listings! Fast forward to now and we’re in and around the 1.5 months range for Barrie, which you can say is a large increase off of the lows of 3 days, but 1.5 months is still very, very low.
This number really should be up in around 4 and 5 months range. This would be considered a balanced market, healthy market. Where it is now, it’s still very much a sellers market and this is really keeping prices where they’re at right now. We are going to have to see a considerable amount of more inventory/ new listings to change this, and with unit sales way down too, that is a possibility but I feel this is unlikely. If we start to see more inventory come onto the market, there’s a chance that this could increase, and then if it continues to get higher, we could see prices come down a little bit more then they have already.
As it stands now with unit sales down and not too many new listings coming onto the market, it’s likely we’re going to see prices stick where they are, if not, possibly even increase which we have actually seen with the January numbers.
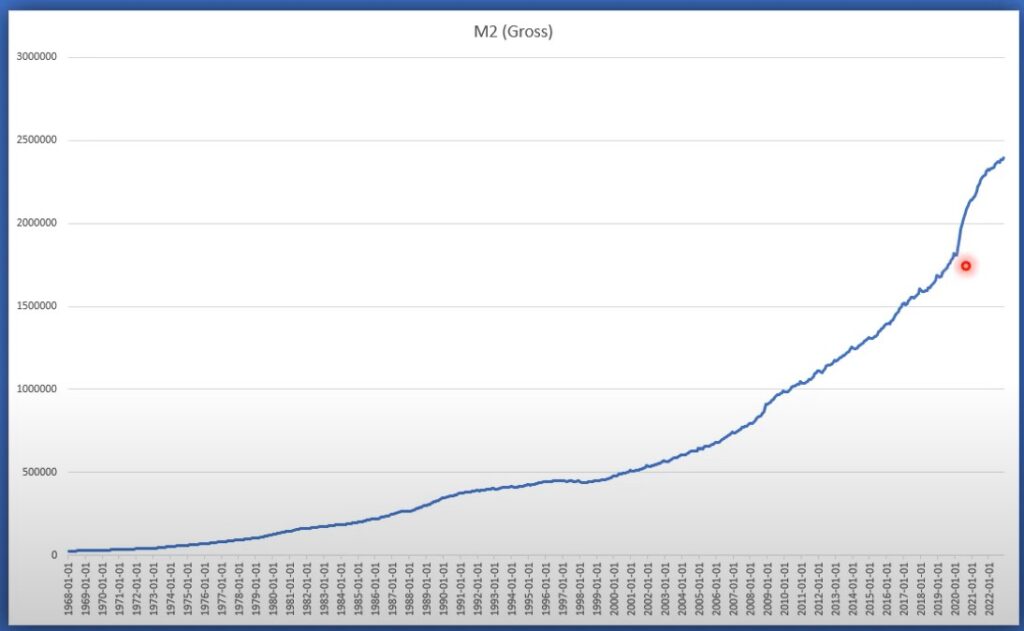
Money Supply (M2) –
This chart is interesting. It goes back to 1980 and it shows the three months change in the growth of the money supply in Canada.
Then this chart shows the total growth of the M2 money supply in Canada and it goes back to 1968. What I thought was interesting is if we put the sales price line that we showed earlier, overtop this chart, (I realize they are different time periods) there is a lot of similarities with the median/ average house price trend line from that chart.
CPI/ Inflation –
This chart shows Canada’s CPI from 2019 until current day. Currently sitting at 5.9%, we are still way higher than what the target rate is for the Bank of Canada but at least we are seeing year over year CPI start to decline and when we look at CPI month over month, it has really flattened out which is positive for the Canadian economy as we move forward.
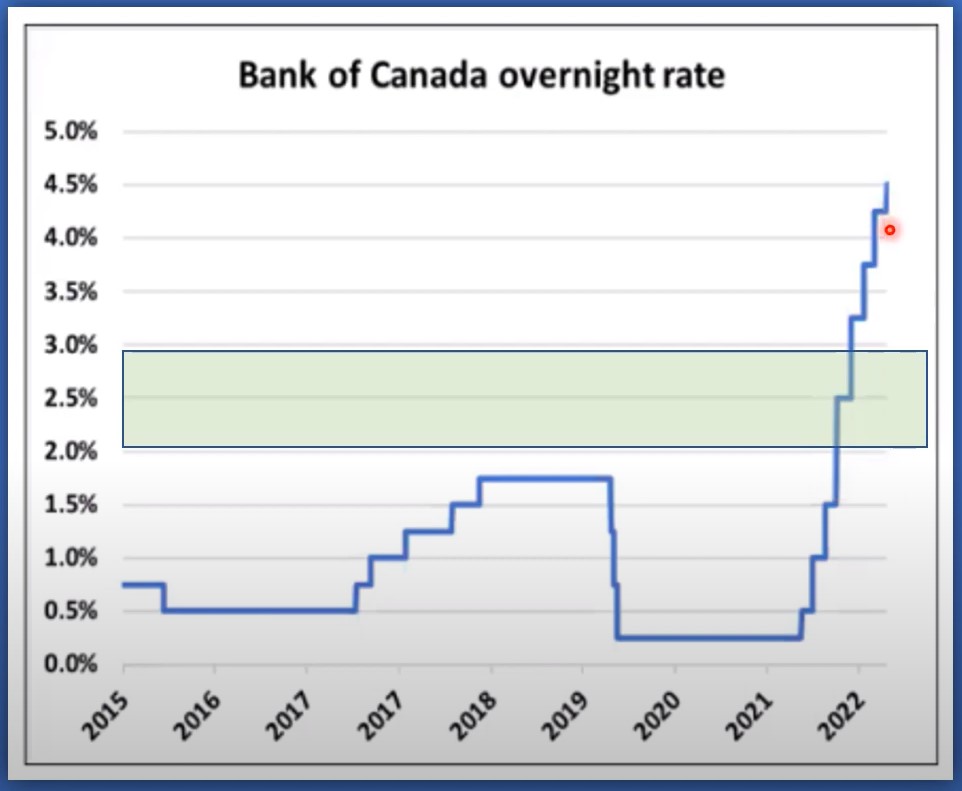
Bank of Canada Overnight Rate –
This chart shows the rapid increase of the overnight interest rate set by the Bank of Canada. Right now we are sitting at 4.5%.
The Bank has stated in a previous monetary report that their neutral rate is in between the 2% and 3% range. The neutral rate is the range where rates don’t necessarily stimulate the economy and they also don’t restrict the growth of the economy. We are still quite a bit above that neutral rate and it’s likely they’re going to pause where we are now (4.5%) until they can see what the status of all these increases does to the economy and the inflation rate. They hope it’s going to cool and slow demand and bring inflation back down to 2% which is their target range. Once CPI/ inflation does cool, it is likely we see the Bank of Canada return the overnight interest rate closer to the neutral range.
Canadian Bond Rates –
The five-year government bond yield is a good leading indicator of what the Bank of Canada is going to do. It also does a great job at forecasting the 5-year fixed rate mortgage. Right now, bond rates are up and down, similar to our overall theme but they have been trending down as of late. When we overlay the five year bond rate with the current mortgage rates, they kind of mirror each other. If the bond yield starts to drop, shortly thereafter, we should see fixed rates start to drop. It’s likely maybe not in the short term (spring), but maybe shortly thereafter we might start to see mortgage rates come down. Right now, mortgage rates, specifically fixed are probably around the 5% range give or take, and variable, which is set off of the prime rate which is derived from the Bank of Canada overnight rate, is around the 5.5% range. If you’re on a variable rate right now, it’s probably going to stay right where it is for most of 2023. And if you’re on a fixed, well, you’re locked in anyways, but if you’re looking at a renewal, it’s likely to decrease within the next few months.
Mortgage Payments –
This chart takes the average price of a home using the home price index which the data is provided by the Canadian Real Estate Association. The chart takes into account putting 20% down and amortizing the mortgage for 30 years, on a current 5 year mortgage rate. In January 2021, the average mortgage payment was around $1,700 a month and Fast forward two years and we’ve nearly doubled, likely closer to $3,200 a month. This has had a profound impact on the CPI.
Let’s look at a local scenario using a recent sale of a home in Barrie. This is a duplex that recently sold. I think they actually got pretty good price relative to where the real estate market is at, but let’s look and see if you were to buy this property at this purchase price what cash flow would look like. For the interest rate, I used 4.9%, which is likely actually kind of low, with 20% down payment, amortized for 30 years. If you were going to rent out the top level and rent out the lower level this is how it breaks down:
Policy Changes –
It is possible we could see OFSI increase the requirements for investors downpayments on investment properties sometime in 2023. If you are looking for an investment property, there are actually properties that have been listed for considerable time on market that you can go in and and you can negotiate right now, which is nice. So even though the inventory is down, there are properties that are sitting there prime for negotiation.
Recession Indicators –
The Organization for Economic Cooperation and Development. They publish this leading indicators chart for all different countries, Canada being one of them. It really does a good job of predicting where GDP is heading. If we were to overlay this leading indicators index on top of Canada’s GDP chart, you can see how close it mirrors each other. These two big dips are where we saw the leading indicators drop, first the financial crisis in 2009 and then again at the onset of Covid. Both times we saw GDP dip, following a dip in the leading indicators index. Right now, we’re still on the way down and our GDP is way up here, so what does this tell us? I think it’s telling us that our GDP is looking most likely to decline, which is signaling in many fashions a recession around the corner which will include a tightening of the labour markets and just overall a more stagnant, cooled economy, which is what the Bank of Canada is trying to do to bring inflation down. But the interesting thing is, once we get to that point of a recession, when do they then look at it from a stimulus perspective?
Population growth –
Population growth in Canada is way up as you can see. This chart goes all the way back to 2000. With population growth as high as it is right now, the majority of that growth are those coming and moving into the GTA, which is going to put additional stress on both our rental and resale real estate markets, which again is another reason why I think we’ll see a little bit of stability in the prices. This will add further demand into the markets.
Summary –
To sum it all up, where do we go from here? I think it’s my perspective that we’re likely to see prices trend horizontal. I don’t think we’re going to see any sharp increase or decrease in prices. Prices will largely depend on inventory levels.
I feel many people have been on the fence. Should we list, should we buy? They are kind of waiting to see where the market goes as for the most part of 2022, the market was in full decline mode and many just didn’t want to get into that situation.
Right now, we have likely hit the bottom and found some stability which I think may prompt some to get back into the market come the spring.
All that being said, I don’t think we’re going to see a massive increase or massive decrease in prices.
If we see one way or the other it will be minimal with maybe a few percent give or take.
For the first time in the past 2-3 years, it’s kind of a safe time to start getting back into the market as these crazy price fluctuations have likely been left behind us.
Is a recession around the corner? The Bank of Canada’s next decision in terms of interest rates (they have their predetermined interest rate decision dates set already) but the next time they move from the current overnight rate I feel will be closer to 2024, if not in 2024 and given what we have looked at, the most likely direction of a change will be down, closer to the neutral rate and to act as more of a stimulus into an economy that has slowed and is in a recession.
Thank you to Ben Rabidoux of North Cove Advisors and Edge Realty Analytics who put together and shared some of the charts and graphs used in this video and article.
Have something to say, send me an email 👉SEND EMAIL.