Is the real estate market starting to change? Based on different forums and social channels that I follow, many in the real estate industry are starting to voice a change/ shift in the marketplace.
Let’s take a closer look at the data to try and make some housing market predictions by looking at the current state of the real estate market here in Barrie.
Some of the metrics we are going to look at:
- New Listings
- Number of Sales
- Sales to New Listings Ratio
- Months of Inventory
- Cancelled Listings
- Number of Showings
- Interest Rates
- Median Sales Price
New Listings:
The number of new listings coming onto the market seems to be on trend. Not abnormally low or high but slightly above the 5 year average for March.
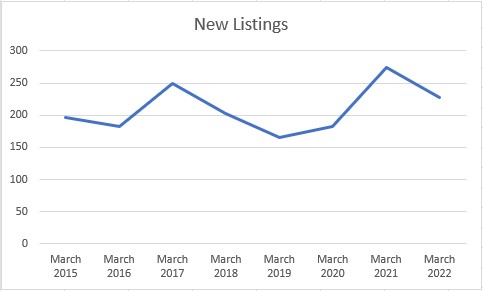
Here is the data:
March 2022 = 228*
March 2021 = 275* (608 for entire month)
March 2020 = 183* (405 for entire month)
March 2019 = 165* (366 for entire month)
March 2018 = 202* (447 for entire month)
March 2017 = 249* (551 for entire month)
March 2016 = 182* (403 for entire month)
March 2015 = 196* (434 for entire month)
*Through 14 days avg.
Number of Sales:
The number of sales is quite a ways off the high of March 2021 and slightly below that of the 5 year average for March but nothing out of the ordinary at this point.
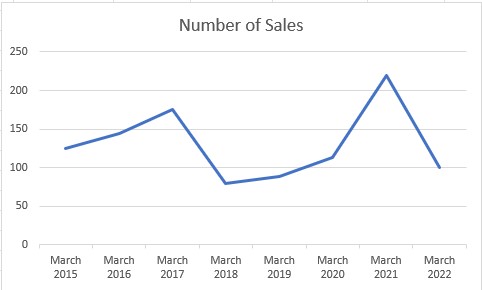
Here is the data:
March 2022 = 100*
March 2021 = 219* (486 for entire month)
March 2020 = 113* (250 for entire month)
March 2019 = 89* (198 for entire month)
March 2018 = 79* (174 for entire month)
March 2017 = 176* (389 for entire month)
March 2016 = 145* (320 for entire month)
March 2015 = 125* (277 for entire month)
*Through 14 days avg
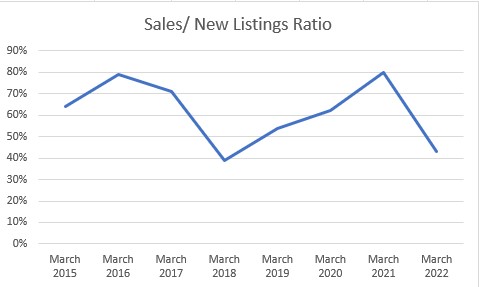
Sales to New Listings Ratio:
March is starting to take a turn in the other direction when it comes to the Sales to New Listings ratio (which for me is a great indicator of future price trends). Currently for the first half of March, Barrie is sitting at a 43% sales to new listing ratio which really is a significant indicator that inventory levels are changing right in front of us.
While it is still early in the month, if this trend were to continue and we finished the month off at below 50% or even close to 50%, there is a very high probability we will see prices start to slow down and perhaps even trend horizontally or possibly decline as we head into April.
It’s much to hard to make a call that prices will decline based off this one statistic, but it does point to a possible shift in inventory levels which I feel makes it more probable that prices decline then increase.
Months of Inventory:
Months of inventory is slowly rising as well, at least off the extreme lows we have seen as of late.
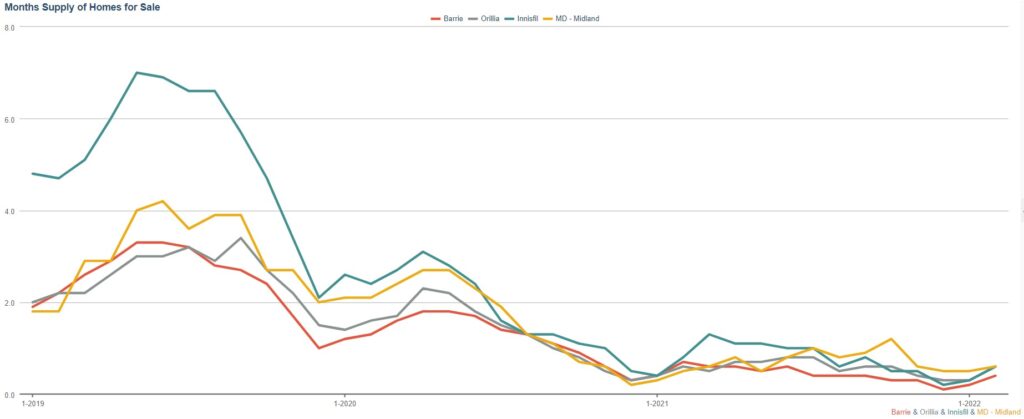
My latest calculation for Barrie came in at 0.91 months of inventory for Barrie which is still very, very low, however we have not seen this much inventory since October 2020 and this is up quite a bit from February 2022 (0.4 months).
Cancelled Listings:
This one is very interesting! Here is how this works and why it is so telling. Rather then adjusting the asking price to reflect a price decrease or in some cases even a price increase on a listing, realtors will cancel the listing and re-list the property at the new asking price. There are many reasons why realtors do this but mainly because the new asking price comes across as a new listing to the general public. Given the low inventory marketplace, there have been very little cancelled listings.
Realtors list a property below market value, set an offer date and let the showings and offers come flooding in. At least that is how it has been for quite some time now.
A slightly different story just this past week though. We are seeing more and more cancelled listings which suggests that properties have been listed and either they are not getting any showings or perhaps offer dates have come and gone without an acceptable offer on the table and realtors are cancelling listings only to re-list the same property at a different asking price.
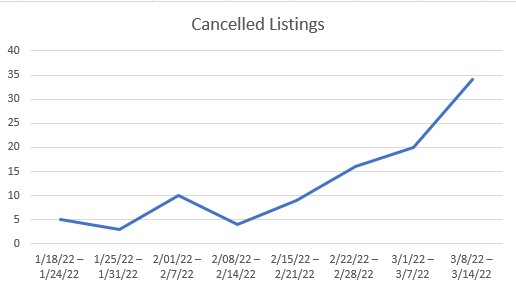
Here is the data:
3/8/22 – 3/14/22 = 34 Cancelled listings
3/1/22 – 3/7/22 = 20 Cancelled listings
2/22/22 – 2/28/22 = 16 Cancelled listings
2/15/22 – 2/21/22 = 9 Cancelled listings
2/8/22 – 2/14/22 = 4 Cancelled listings
2/1/22 – 2/7/22 = 10 Cancelled listings
1/25/22 – 1/31/22 = 3 Cancelled listings
1/18/22 – 1/24/22 = 5 Cancelled listings
Number of Showings:
Another interesting metric we can look at is the number of showings that are being scheduled.
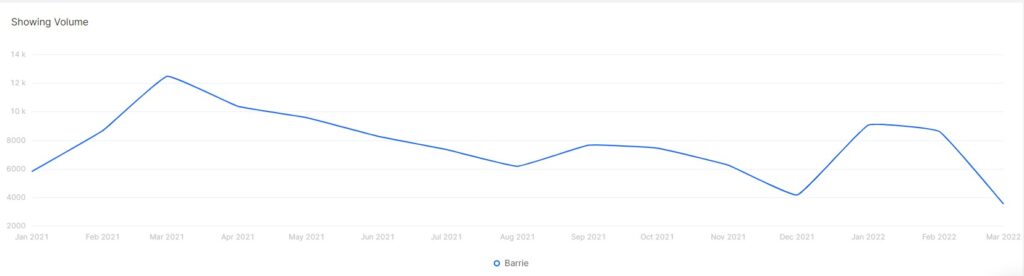
Just this past week, the same week we saw increased cancelled listings, we also experienced a significant decline in the number of showings being scheduled across this highly utilized showing system.
While a week here and there does not make a trend, it is something to keep an eye on.
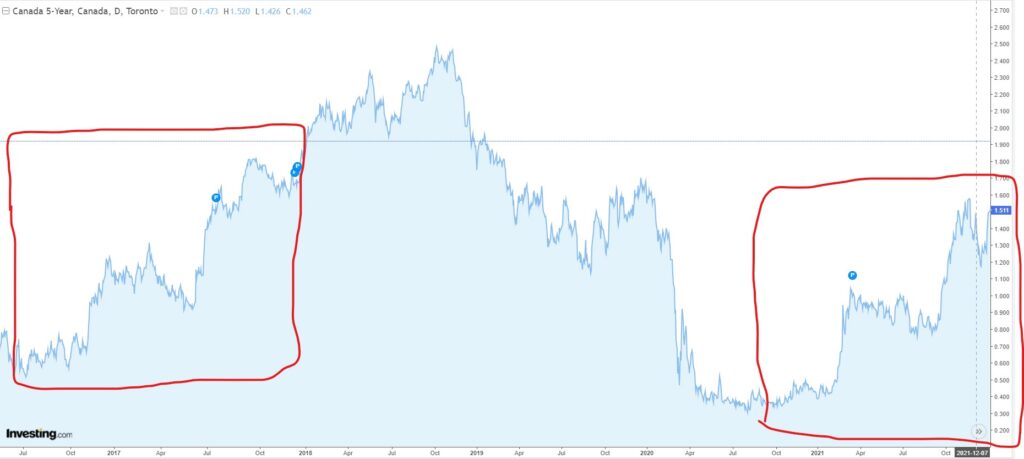
Interest Rates:
The Canada 5-Year bond rate continues to rise, currently sitting at levels not seen since mid January 2019. This along with the news from the Bank of Canada on March 2nd that the overnight rate was finally increasing off the low 0.25% to 0.5% has possibly created a change in consumer behaviour and confidence. I would expect that we will see another increase to the overnight rate on April 13th, increasing to 0.75%.
Quick analysis of the Canada 5 Year Bond Rate, and by no means am I a technical analyst, but there are some similarities that can been seen with the 5-year bond rate chart, specifically the period of late 2016 into mid 2017. During this time as you probably well know, real estate prices increased sharply across the province followed by a significant decrease as a result of many factors, of which increasing fixed rate mortgages played a role.
Sales Prices:
As far as prices go, currently in Barrie we are sitting at a median sales price of $925,125.
This is down from February 2022, in which the median sales price was $933,500 and at one time near $950,000.
Could this be the top of the market?
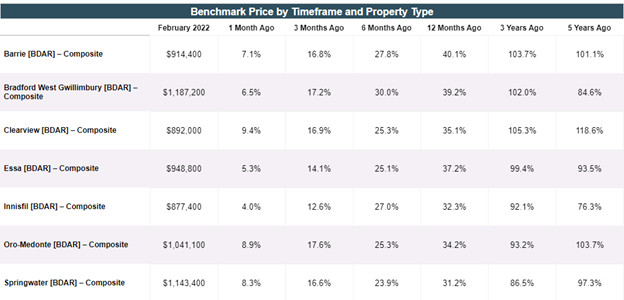
Check out the benchmark prices for different areas of Simcoe County:
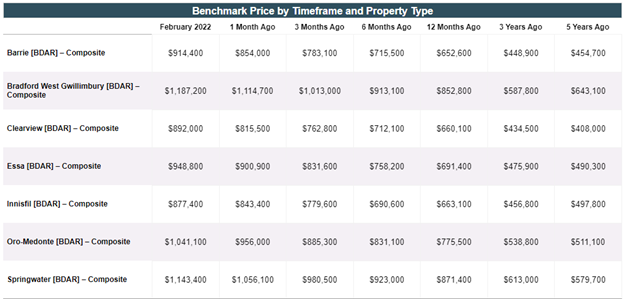
For those wondering how much of a percent increase during these timeframes 👇
Where does it go from here? Nobody knows.
A week of data does not make a trend and I do remember weeks in March 2021 where it seemed as though the real estate market was starting to show signs of slowing but when it was all said and done, we did not experience much of a slow down if at all.
Economic conditions are in a different place then what they were only a year ago. I will be watching with a close eye to see where we go from here.